
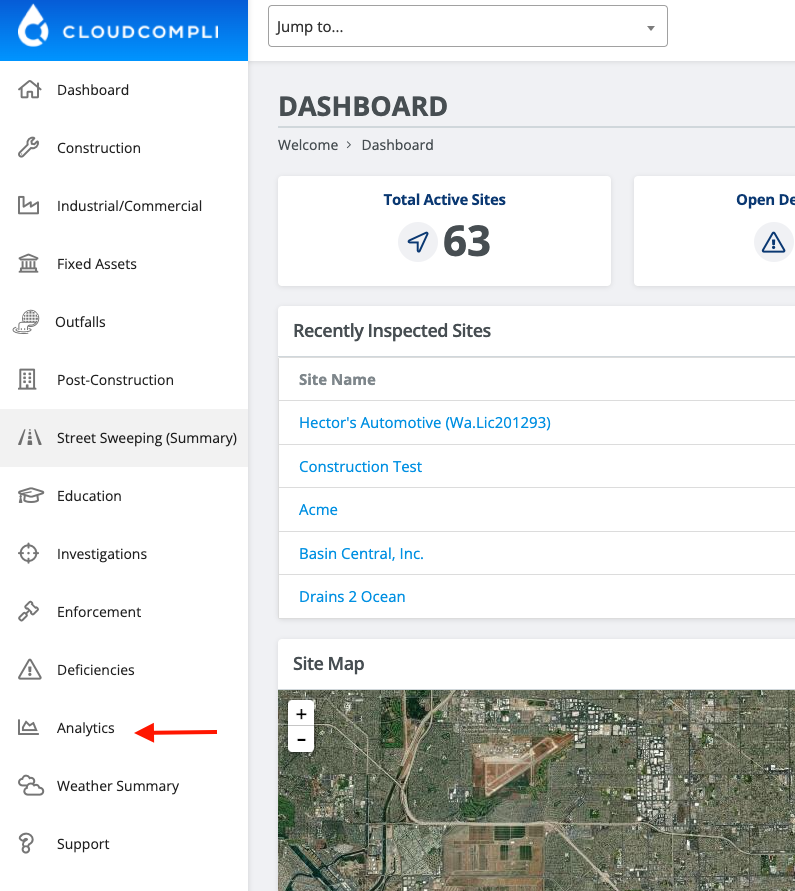
To locate this analytic, from the Navigation Panel, select Analytics towards the bottom.
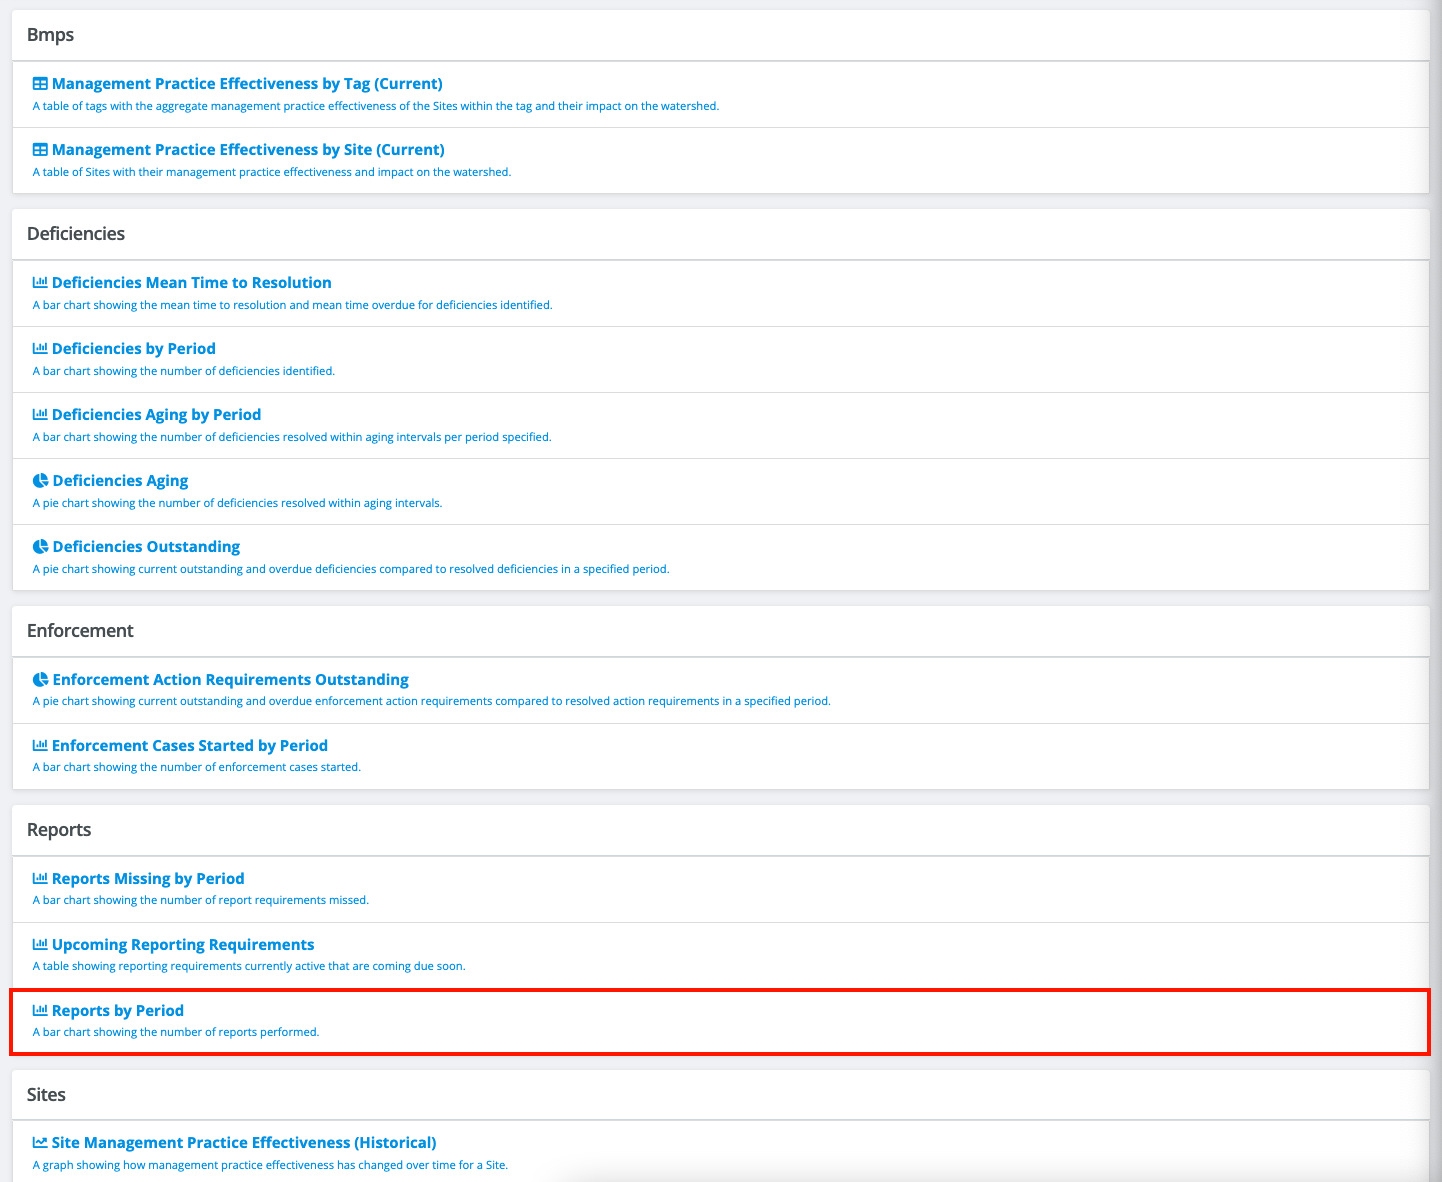
From the Analytics page, under Reports, select "Reports by Period". Note: some analytics shown below may not be available on your account. Please contact support@cloudcompli.com to activate or create a custom analytic.
Once on the Reports by Period analytic, narrow your search by using the filter options below the bar chart. Filter by:
Site Name
Period (e.g., Yearly, Month to Date, etc.)
Program Type (e.g., Construction, Industrial, etc.)
Report Type (e.g., Sampling, REAP, etc.)
Report Name
Ste Tags or Categories
Publishing User
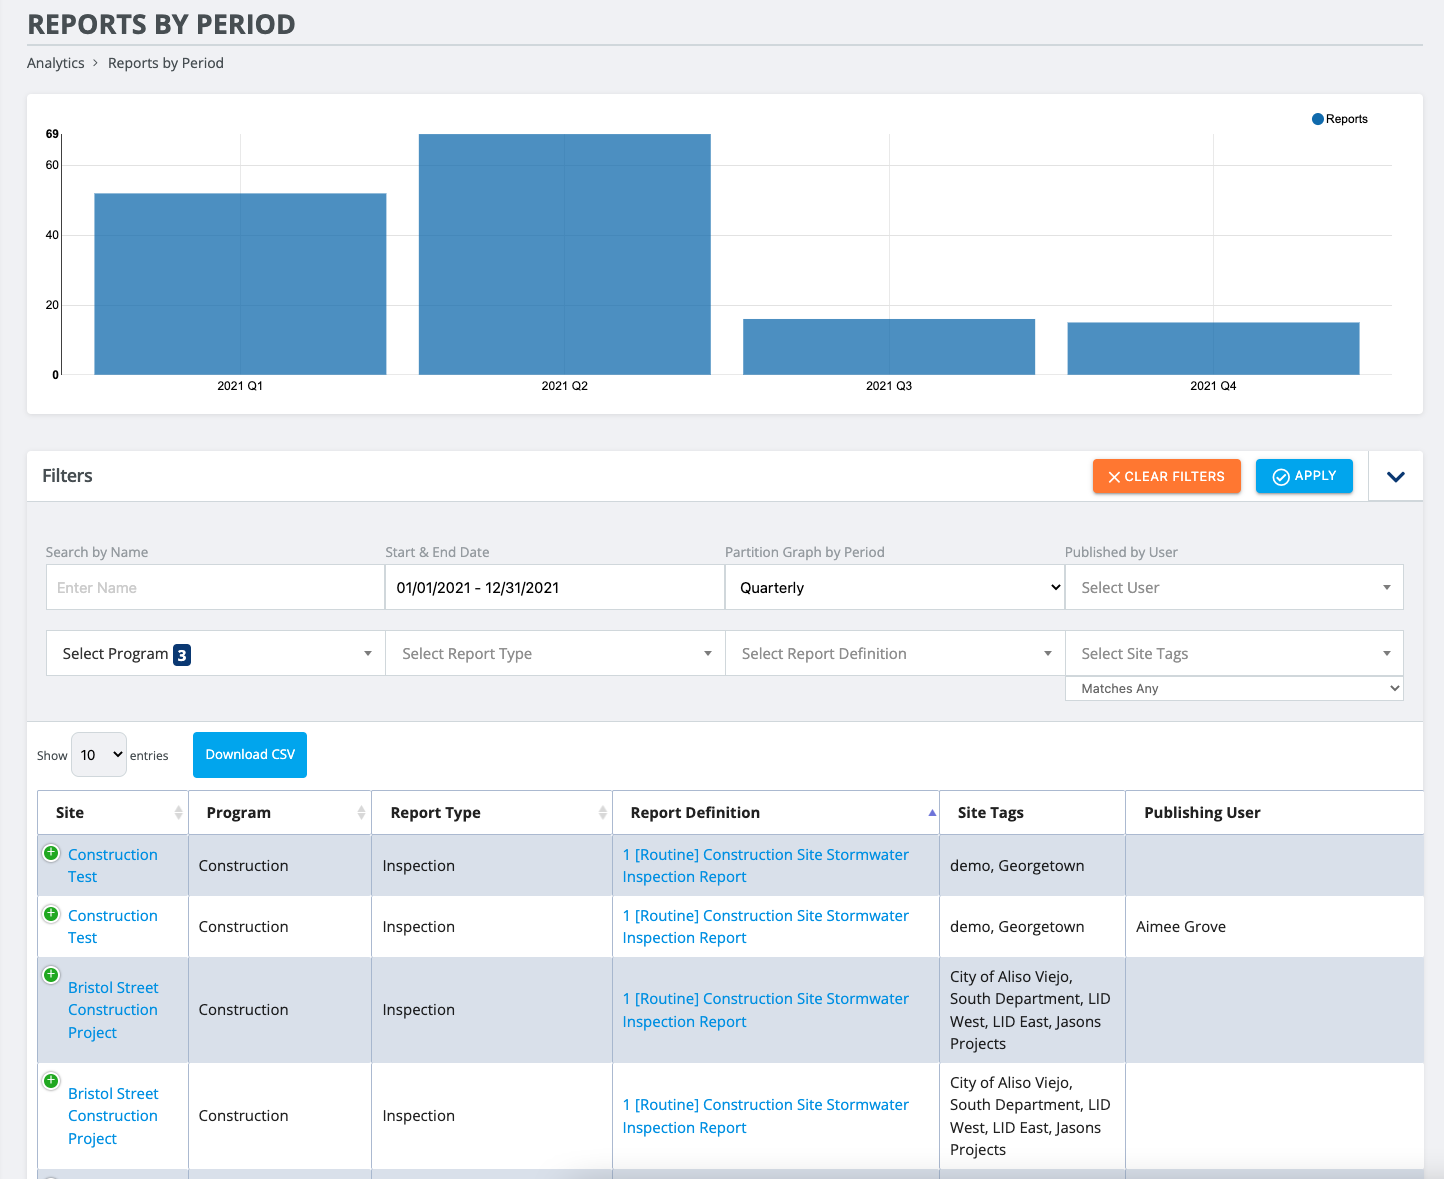
To export filtered data as a csv/xlsx file, select the "Download CSV" button above the table to download all entries.
*Depending on your browser or computer resolution size, use the green plus button on the right of each entry to reveal the inspection date.